Dashboard

Management Dashboard — Tenant and Property Management Overview

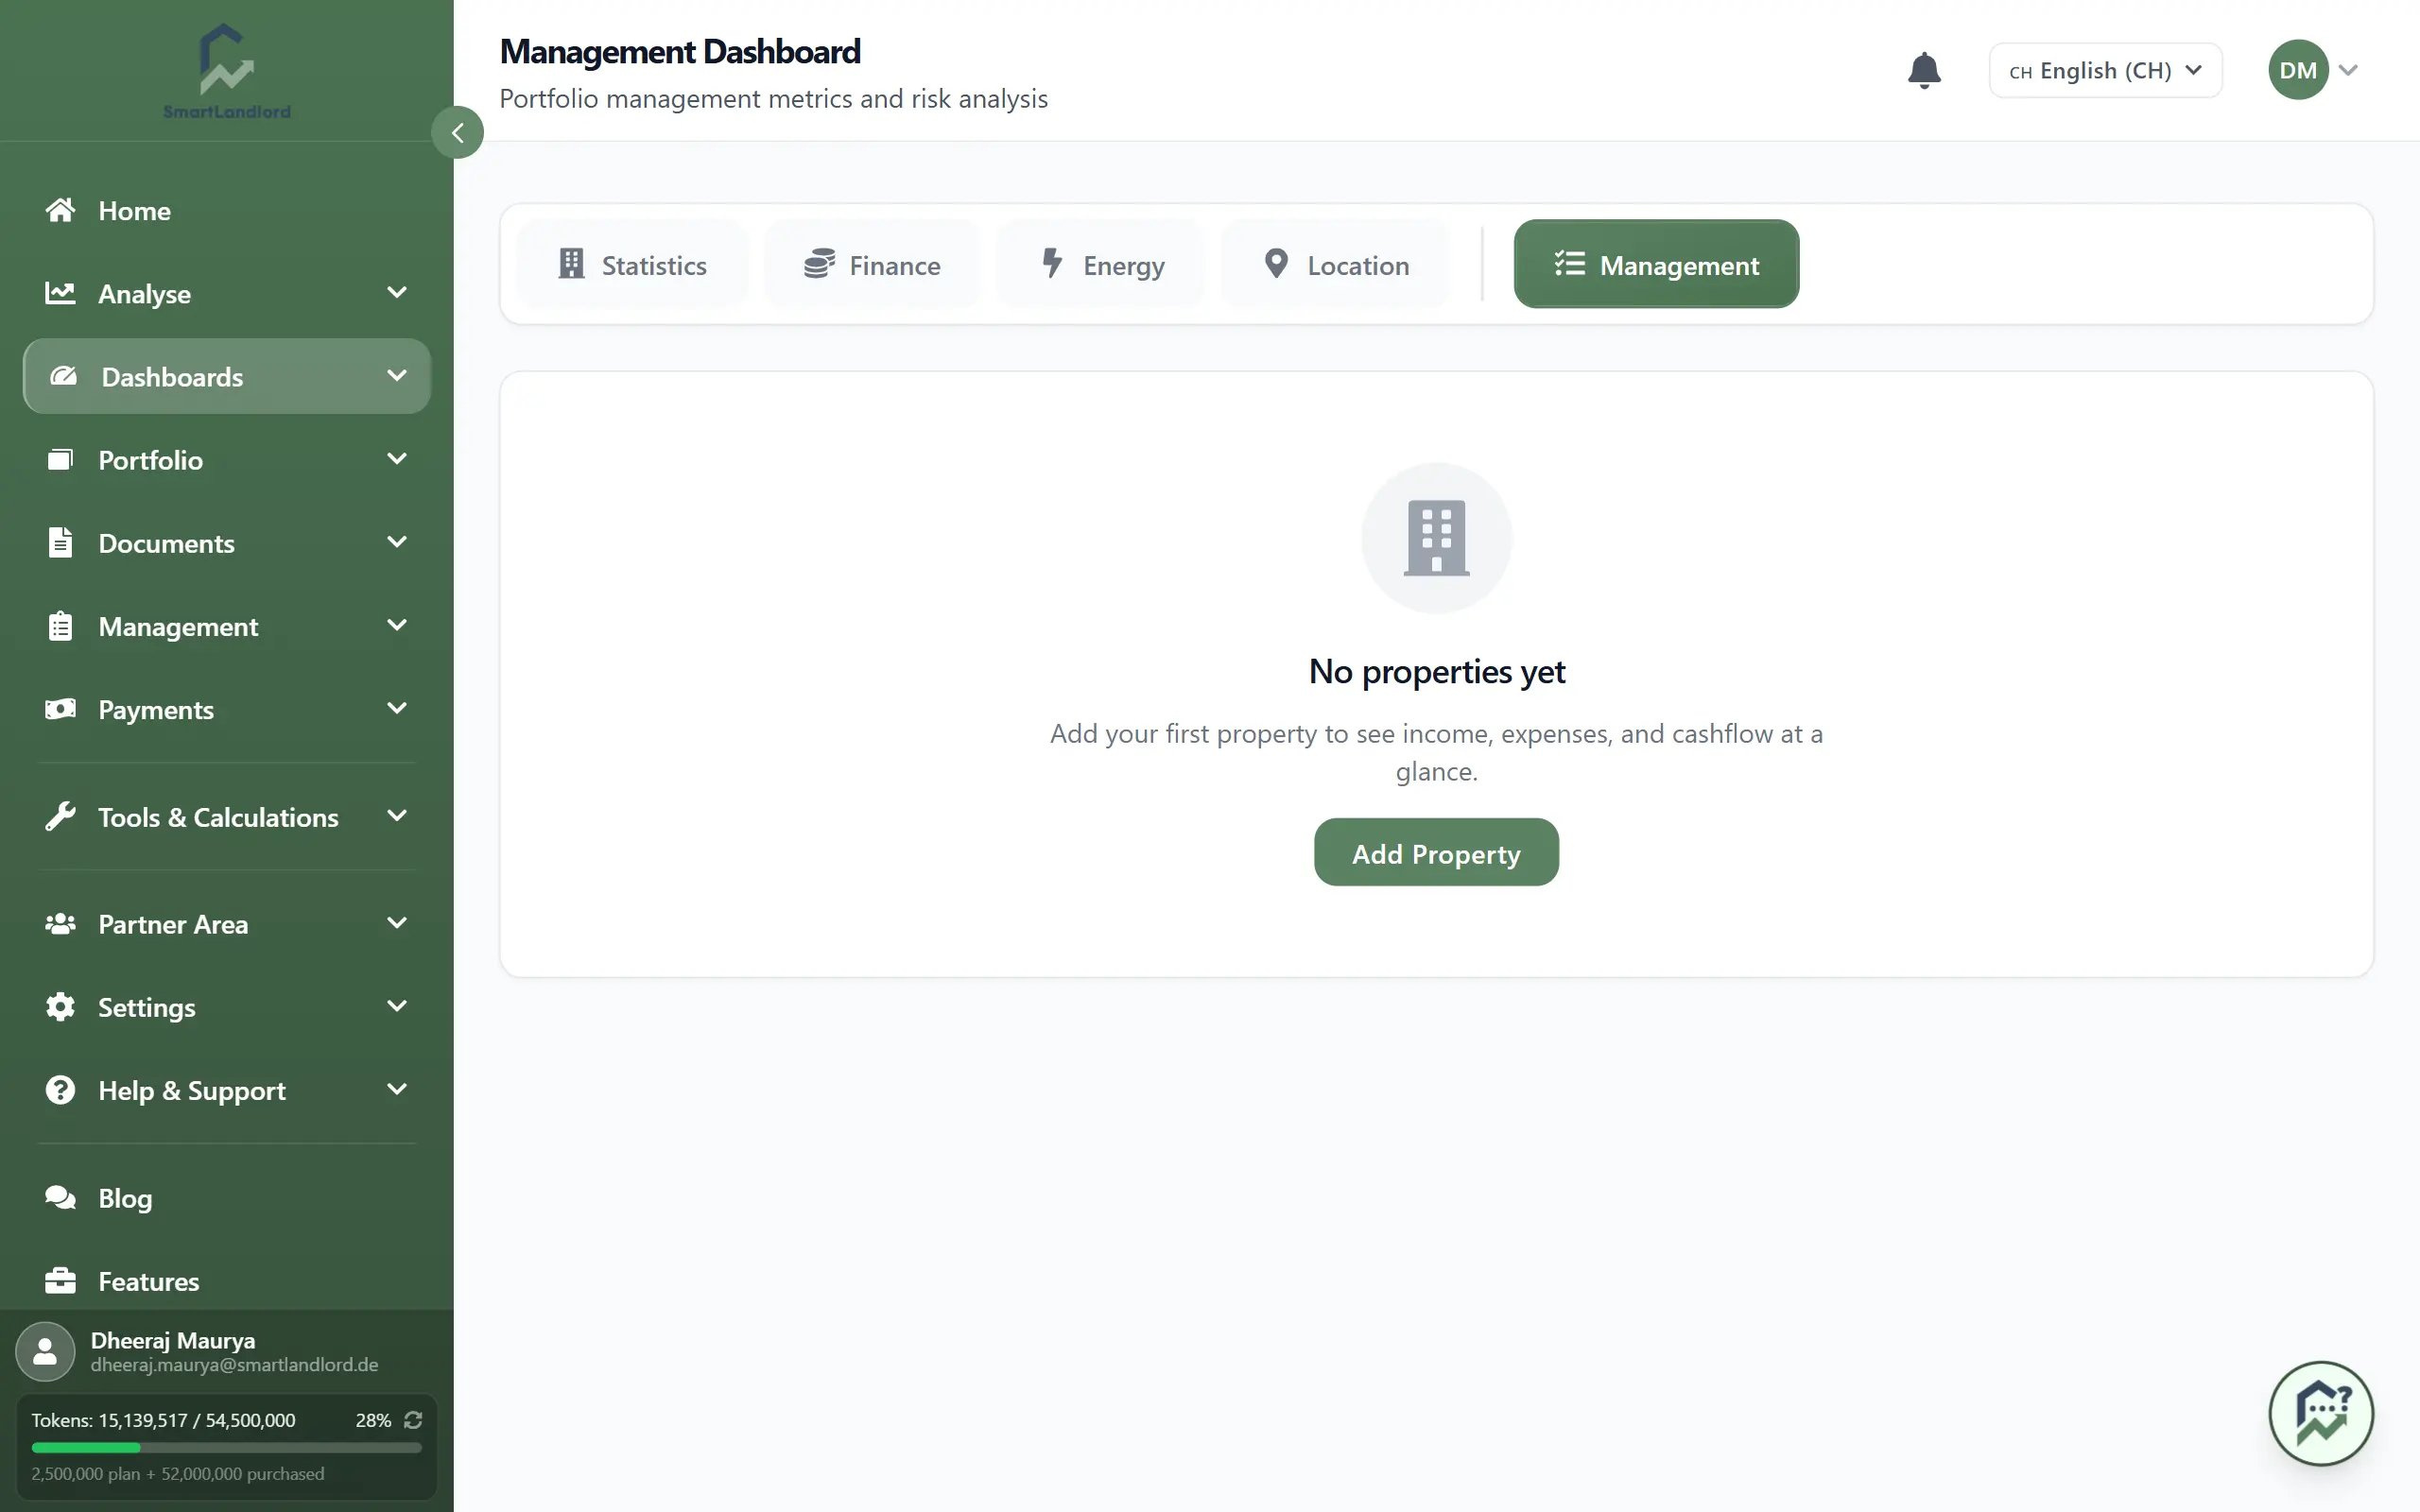
The Dashboard gestione gives a management-level overview of your portfolio. Open it under DashboardDashboard gestione.

The dashboard relies on current income, expense, tenant, lease, and property data. Keeping these records up to date ensures that the displayed information remains accurate and useful.

Use this dashboard to see how your portfolio is performing against plans, track cashflow, monitor rental performance and costs, and spot key risks at a glance.

1. What you see

The management dashboard shows these main sections:

  • Analisi del piano rispetto alla realtà – planned vs. actual income and expenses.
  • Previsione del flusso di cassa – projected cashflow.
  • Prestazioni di noleggio – rent, vacancy, and on-time payments.
  • Monitoraggio dei costi – costs and trends.
  • Radar del rischio – key risk indicators at a glance.

2. Analisi del piano rispetto alla realtà

This section compares your planned budget to what actually happened.

You typically see:

  • Planned income vs actual income.
  • Planned expenses vs actual expenses.
  • Differences (variances) showing where you are over or under plan.

Use it to:

  • Spot income or expenses that are significantly off plan.
  • Understand which areas need closer attention.
  • Adjust future budgets based on real performance.

Large variances between planned and actual figures should be reviewed promptly to understand their cause and determine whether corrective action is required.

Management dashboard overview

3. Previsione del flusso di cassa

This section shows your projected cashflow over time.

You typically see:

  • Future cashflow by month or period.
  • Expected income and expenses over the forecast period.
  • Trends showing whether cashflow is improving or tightening.

Use it to:

  • Plan for months with low or negative cashflow.
  • Prepare for large expenses or loan payments.
  • Decide when to invest or delay upgrades based on cash position.

Cashflow forecasts are based on available data and assumptions. Review forecasts regularly and update underlying records when circumstances change.

4. Prestazioni di noleggio

This section focuses on how well your properties are renting.

You typically see:

  • Rent levels and rent collection.
  • Vacancy rates or vacant units.
  • On-time payment rates or late payment indicators.

Use it to:

  • Identify properties with high vacancy or low rent collection.
  • Track whether tenants are paying on time.
  • Compare performance across properties or regions.

High vacancy rates, poor rent collection, or recurring late payments may indicate issues that require immediate attention.

5. Monitoraggio dei costi

This section tracks your operating costs and how they change over time.

You typically see:

  • Total costs by period.
  • Breakdown by cost type (for example, maintenance, insurance, utilities).
  • Trends showing increases or decreases.

Use it to:

  • Spot rising costs early.
  • Compare cost categories.
  • Identify properties or areas with unusually high expenses.

Unexpected increases in operating costs should be investigated early to avoid long-term impacts on profitability.

6. Radar del rischio

The risk radar gives you a quick view of key risks in your portfolio.

You typically see:

  • Indicators for risks such as:
  • High vacancy.
  • Late payments or arrears.
  • Expiring leases.
  • High maintenance or cost pressure.
  • Simple ratings or colours (for example, green, yellow, red) to show severity.

Use it to:

  • Quickly see which properties or areas are risky.
  • Focus your attention on the most serious issues.
  • Plan actions to reduce risk (for example, renew leases, address arrears).

Review high-risk items regularly and prioritize issues marked with the highest severity levels.

7. Tips

  • Use the management dashboard for monthly reviews of your portfolio.
  • Combine insights from all sections before making decisions (for example, don’t rely on cashflow alone).
  • Keep your income, expense, and lease data up to date so the dashboard reflects reality.

The most effective decisions come from reviewing plan performance, cashflow, rental metrics, costs, and risks together rather than relying on a single dashboard section.